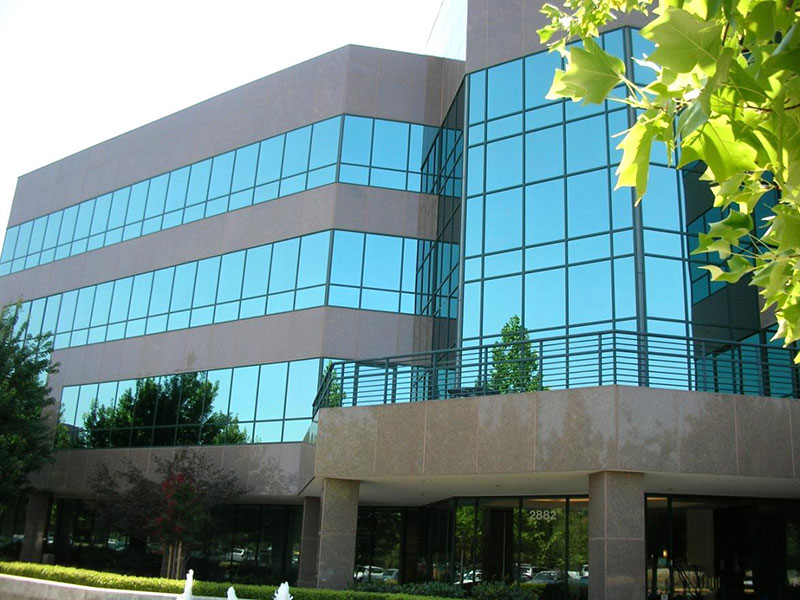
Sacramento office property tax appeals are significantly affected by key metrics such as market vacancy and market rent. These recent trends are summarized below.
| Vacancy % | Total Available % | Total Inventory SF | Average Asking Rent | |
|---|---|---|---|---|
| Highway 50 Corridor | 20.2% | 26.8% | 11,139,738 | $1.85 |
| Roseville/Rocklin | 12.2% | 18.7% | 7,632,876 | $2.02 |
| Suburban | 14.8% | 19.7% | 41,973,732 | $1.91 |
| Downtown | 11.8% | 16.6% | 10,154,954 | $3.08 |
| Total Market | 14.2% | 19.1% | 52,128,686 | $2.12 |
Analysis By WPA 2022
Data By CBRE Market Research 2022
Cities and neighborhoods included in this market include Campus Commons, Carmichael, Fair Oaks, Citrus Heights, Orangevale, East Sacramento, Elk Grove, Galt, Folsom, Howe, Fulton, Watt, Highway 50 Corridor (Including Rancho Cordova), Sacramento Midtown, Northgate/Natomas, Point West Tribute, Roseville, Rocklin, South Natomas, South Sacramento, Watt Avenue/Auburn Boulevard, West Sacramento, Suburban Sacramento, Downtown Sacramento.
Sacramento County retail building property tax appeals are significantly affected by key metrics such as market vacancy and market rent. These recent trends are summarized below.
| Vacancy % | Total Available % | Total Inventory SF | Average Asking NNN Rent | |
|---|---|---|---|---|
| Arden/Watt/Howe | 7.80% | 11.20% | 3,643,210 | $1.43 |
| Auburn/loomis | 5.80% | 6.50% | 1,152,690 | $2.09 |
| Carmichael | 15.90% | 17.20% | 1,071,163 | $1.20 |
| Citrus Heights/Fair Oaks | 7.50% | 8.80% | 4,868,920 | $1.22 |
| Folsom/El Dorado Hills | 5.30% | 6.30% | 5,341,789 | $2.07 |
| Greenhaven/Pocket | 6.70% | 7.20% | 429,018 | $1.88 |
| Hwy 50/Rancho Cordova/Rosemont | 12.10% | 14.10% | 2,901,512 | $1.49 |
| Laguna/Elk Grove | 2.20% | 2.60% | 5,870,818 | $2.17 |
| Lincoln | 1.00% | 1.00% | 1,168,982 | $2.43 |
| North Highlands | 3.70% | 5.40% | 2,583,559 | $1.43 |
| North Natomas | 3.60% | 4.80% | 3,379,685 | $2.05 |
| Rocklin | 4.90% | 6.40% | 2,579,959 | $1.59 |
| Roseville | 4.30% | 6.60% | 6,416,935 | $1.98 |
| South Natomas | 7.70% | 13.30% | 656,257 | $1.46 |
| South Sacramento | 5.80% | 8.00% | 4,465,124 | $1.37 |
| West Sacramento/Davis | 8.30% | 9.40% | 2,640,922 | $1.92 |
| Greater Sacramento Retail Market | 5.80% | 7.40% | 49,170,543 | $1.58 |
Analysis By WPA 2023
Data By CBRE Market Research 2023
The largest cities in Sacramento County by population include: Sacramento, Elk Grove, Arden-Arcade, Citrus Heights, Carmichael, Folsom, Rancho Cordova, Florin, North Highlands, Antelope, Vineyard, Orangevale, Laguna, Foothill Farms, Fair Oaks, and Galt.
Sacramento County hotel property tax appeals are significantly affected by key metrics such as market vacancy and market rent. These trends are summarized below.
| UNITED STATES DATA | Total | Change From 2019 |
|---|---|---|
| Occupancy | 62.70% | -4.90% |
| ADR | $149.00 | 13.6% |
| RevPAR | $93.27 | 8.10% |
Analysis By WPA 2023
Data By STR, TE, February 3, 2023 (Published), As of December 31, 2022
2022 Year End Indicators
* Uneven, non-linear recovery across industry segments.
* Overall construction pipeline activity is down. Some December 2022 growth in construction is seen.
Sacramento County multi-family property tax appeals are significantly affected by key metrics such as market vacancy and market rent. These recent trends are summarized below.
| Total | |
|---|---|
| Vacancy | 5.20% |
| Average Effective Market Rent | $1,926 |
| Y-O-Y Avg. Effective Rent Increase | 1.80% |
| Construction Units Completed (Past 12 Mos.) | 1,987 Units |
| % Increase in Inventory (Past 12 Mos.) | 1.26% |
Analysis By WPA 2023
Data By Marcus & Millichap 2023
The largest cities in Sacramento County by population include: Sacramento, Elk Grove, Arden-Arcade, Citrus Heights, Carmichael, Folsom, Rancho Cordova, Florin, North Highlands, Antelope, Vineyard, Orangevale, Laguna, Foothill Farms, Fair Oaks, and Galt.
Sacramento County tips the northerly region of the Central Valley, and is located north of San Joaquin and Contra Costa Counties, east of Solano and Yolo Counties, south of Sutter, Yuba, and Placer Counties, and west of Eldorado and Amador Counties. Sacramento is the largest city in the county bearing its name.
The office market in Sacramento in the fourth quarter of 2022 reached 19.7% availabilities (including both direct vacancy and sublease availabilities). Direct vacancy was lower at 14.8%, reflecting significant subleasing offerings. Absorption in the market overall was barely positive, but in the downtown was negative.
The Highway 50 Corridor posted the weakest showing in occupancy with 26.8% total availabilities and a direct vacancy of 20.2%. Unlike the overall market, this sub-market experienced negative absorption of 69,661 square feet. These trends are especially noteworthy since the Highway 50 Corridor is the largest sub-market, containing 11,139,738 square feet of inventory, or 26.5% of the total market area of 41,973,732 square feet.
The next largest sub-market is the South Natomas office market which contains only 3,298,340 square feet, and represented the next highest availability and vacancy percentages, at 23.4% and 19.0%, respectively. It is significant that the two largest sub-markets are experiencing the highest vacancy, as these markets often lead the trends for the greater market.
Work from home trends (WFH) continue to be a concern for the market, as are rising interest rates and an uncertain future path for the economy as of year-end 2022.

Director, Valuation Services
dglasser@taxappealsbywpa.com