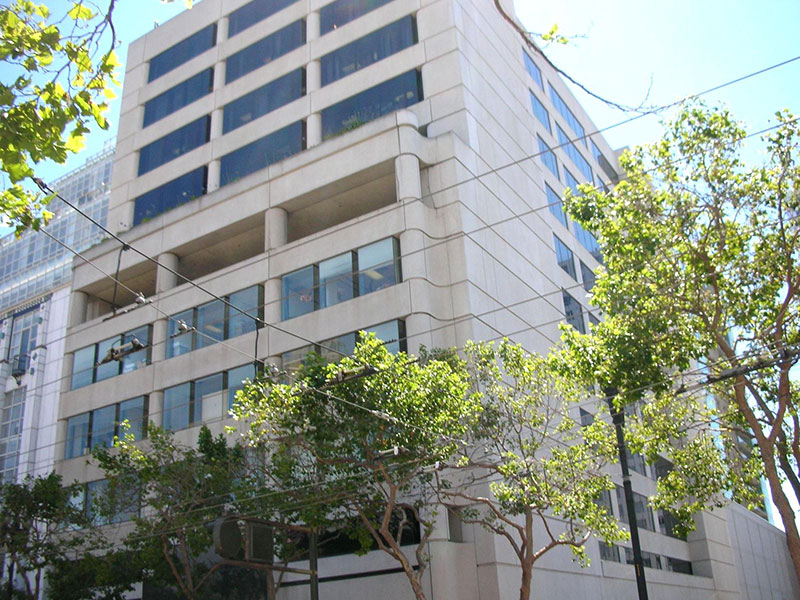
San Francisco office property tax appeals are significantly affected by key metrics such as market vacancy and market rent. These recent trends are summarized below.
| Vacancy % | Total Available % | Total Inventory SF | Average Asking Rent | |
|---|---|---|---|---|
| North Financial | 28.0% | 32.3% | 27,180,161 | $76.43 |
| North Financial Class A | 24.4% | 28.5% | 21,071,009 | $80.14 |
| South Financial | 24.8% | 33.5% | 25,426,810 | $80.07 |
| South Financial Class A | 23.4% | 32.9% | 22,685,361 | $81.99 |
| Union Square | 28.3% | 29.0% | 3,819,199 | $61.81 |
| Union Square Class A | 56.3% | 56.3% | 401,944 | $73.31 |
| Total San Francisco Class A | 27.1% | 33.7% | 59,567,614 | $81.21 |
| Total San Francisco Market | 29.4% | 35.0% | 86,955,801 | $75.17 |
Analysis By WPA 2023
Data By CBRE Market Research 2023
Neighborhoods included in this market include North Financial District, South Financial District, North Waterfront/Jackson Square, South of Market, Yerba Buena, South of Market West, Mission Bay / China Basin, Potrero Hill, Civic Center / Van Ness Avenue, and Union Square.
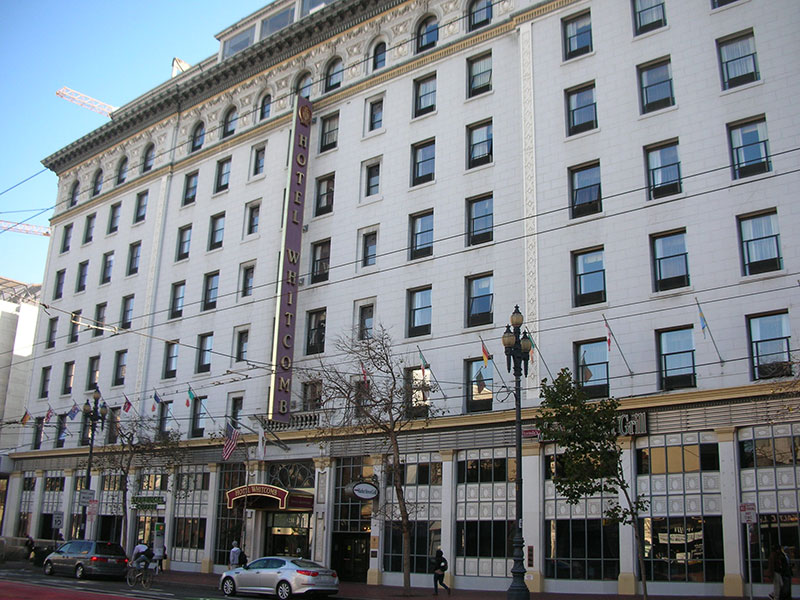
San Francisco hotel property tax appeals are significantly affected by key metrics such as market vacancy and market rent. These trends are summarized below.
| UNITED STATES DATA | Total | Change From 2019 |
|---|---|---|
| Occupancy | 62.70% | -4.90% |
| ADR | $149.00 | 13.6% |
| RevPAR | $93.27 | 8.10% |
Analysis By WPA 2023
Data By STR, TE, February 3, 2023 (Published), As of December 31, 2022
2022 Year End Indicators
* Uneven, non-linear recovery across industry segments.
* Overall construction pipeline activity is down. Some December 2022 growth in construction is seen.
San Francisco industrial building property tax appeals are significantly affected by key metrics such as market vacancy and market rent. These trends are summarized below.
| 2019 | 2020 | 2021 | 2022 | |
|---|---|---|---|---|
| Vacancy (Citywide) | 2.79% | 4.47% | 3.78% | 4.14% |
| Absorption (Citywide) | 3.184 SF | -361,934 SF | 150,044 SF | -78,925 SF" |
| Asking Rents (Citywide) | $2.33/SF | $2.09/SF | $2.27/SF | $2.52/SF |
Analysis By WPA 2023
Data By CBRE Market Research 2023
East side San Francisco neighborhoods: North Financial District, South Financial District, Yerba Buena, South Beach, Telegraph Hill, North Beach, Fisherman’s Wharf, Russian Hill, Nob Hill, Union Square, Tenderloin, Civic Center, Marina, Cow Hollow, Pacific Heights, Western Addition, Laurel Heights, Alamo Square, Hayes Valley, Mission Bay, Potrero Hill, Inner Mission, Bayview, Bernal Heights.
San Francisco retail building property tax appeals are significantly affected by key metrics such as market vacancy and market rent. These recent trends are summarized below.
| Vacancy % | Total Available % | Total Inventory SF | Average Asking NNN Rent | |
|---|---|---|---|---|
| North Bay | 3.37% | 5.06% | 27,980,368 | $25.55 |
| East Bay | 6.27% | 8.58% | 52,504,697 | $30.56 |
| West Bay | 5.26% | 5.92% | 12,809,448 | $45.79 |
| South Bay | 4.83% | 6.08% | 38,179,947 | $35.91 |
| Total Bay Area Retail Market | 5.14% | 6.85% | 131,474,460 | $32.75 |
Analysis By WPA 2023
Data By CBRE Market Research 2023
East side San Francisco neighborhoods include: North Financial District, South Financial District, Yerba Buena, South Beach, Telegraph Hill, North Beach, Fisherman’s Wharf, Russian Hill, Nob Hill, Union Square, Tenderloin, Civic Center, Marina, Cow Hollow, Pacific Heights, Western Addition, Laurel Heights, Alamo Square, Hayes Valley, Mission Bay, Potrero Hill, Inner Mission, Bayview, Bernal Heights.
San Francisco multi-family building property tax appeals are significantly affected by key metrics such as market vacancy and market rent. These recent trends are summarized below.
| Total | |
|---|---|
| Vacancy | 6.50% |
| Average Effective Market Rent | $2,811 |
| Y-O-Y Avg. Effective Rent Increase | 0.30% |
| Construction Units Completed (Past 12 Mos.) | 3,233 Units |
| % Increase in Inventory (Past 12 Mos.) | 1.30% |
Analysis By WPA 2023
Data By Marcus & Millichap 2023
East side San Francisco neighborhoods include: North Financial District, South Financial District, Yerba Buena, South Beach, Telegraph Hill, North Beach, Fisherman’s Wharf, Russian Hill, Nob Hill, Union Square, Tenderloin, Civic Center, Marina, Cow Hollow, Pacific Heights, Western Addition, Laurel Heights, Alamo Square, Hayes Valley, Mission Bay, Potrero Hill, Inner Mission, Bayview, Bernal Heights.
The City and County of San Francisco is a major metropolitan area in Norther California, surrounded on three sides by water, and bordered to the south by San Mateo County, connected to Marin County by the Golden Gate Bridge to the north, and connected to Alameda County to the east by the Bay Bridge, traversing the San Francisco Bay. In recent years, this historic and important city has taken on leadership which proposes unusual solutions to key concerns.
San Francisco in 2023 may be awarded the dubious crown for leading the state in negative net absorption. Total office availabilities reached a staggering 35.0%, of which 33.7% was for Class A space. Direct vacancy was 29.4%, and Class A space was only slightly lower at 27.1%. Of the total Class A inventory in the market at 59,567,814 SF, the negative absorption in the first quarter alone was 1,513,687 square feet, which comprised nearly all of the negative absorption for the quarter (96.6%).
Negative absorption has become a rapidly rising trend in The City. By comparison, we note that the Greater Los Angeles office market is well over double the inventory of the San Francisco market, and yet negative absorption in square feet is higher in San Francisco.
The highest availability rates are observed in Class A market segments in the South of Market area and Union Square. South of Market West experienced the highest availability rate for Class A space at 66.4%, followed by Yerba Buena Class A space at 64.2%, and Union Square Class A availabilities at 56.3%. The two largest San Francisco office sub-markets, also with the two largest sets of inventory of Class A space, are North Financial District and South Financial District, running Class A availabilities of 28.5% and 32.9%, respectively.
Not surprisingly, rising vacancy trends spanning a range of property types in the downtown has caught the attention of city leaders in 2023. In response to the loss of over half of the tenancy at a prime downtown regional mall, the Mayor was quick to suggest a simple solution, as demolition of this private property for possible replacement with a soccer stadium. While this plan was not likely vetted through any knowledgeable real estate or planning professionals, many have suggested that this type of policy leadership has played a role in the growing ills of The City. Though such plans are not likely to materialize, the high concentration of technology employment in the City is a concern to some commercial real estate professionals, due to risks of industrywide cutbacks in labor and real estate usage throughout the sector as economic conditions shift.
Trends countywide are of vacancy rising to levels rarely seen, and absorption running negative or nearly negative in most sub-markets. Work from home trends, rising interest rates, and economic adjustments are showing their effects.
© All rights reserved

Director, Valuation Services
[email protected]